Air quality standards have become more stringent
The Active House Alliance believes that our homes should be both high-quality and healthy. That is why one of the criteria is indoor air quality assessment. It is measured by the concentration of carbon dioxide (CO₂). CO₂ affects human productivity, and when the concentration exceeds 1000 ppm, ventilation is required.
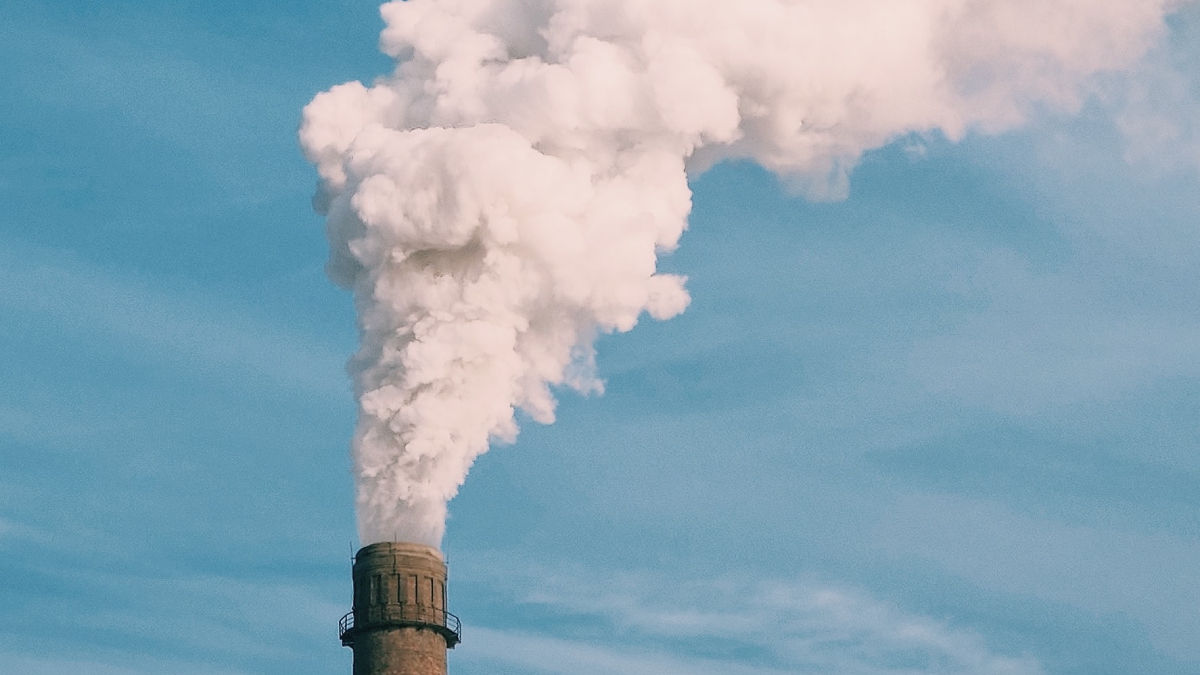
But how clean is the air outside your window?
The World Health Organization (WHO) established quantitative air quality indicators back in 2005—permissible concentrations of pollutants with the most documented negative health effects. Since then, new scientific data has accumulated, prompting the need for updated guidelines.
In 2021, the WHO reported that health is harmed by air containing lower concentrations of pollutants than previously thought. Almost all recommended threshold values were reduced.
- Fine particulate matter can penetrate deep into the lungs
- Recommended threshold concentrations of particles
- Sources of PM are human-related
- PM concentrations decrease from south to north of Ukraine
- Ground-level ozone triggers asthma
- Recommended threshold concentrations of O₃
- O₃ sources are human-related
- The highest O₃ pollution is in southeastern Ukraine
- Nitrogen dioxide increases vulnerability of the respiratory system
- Recommended threshold concentrations of NO₂
- NO₂ sources are human-related
- High NO₂ concentrations are observed in Ukraine’s major cities
- SO2 spikes increase heart-related hospitalisations
- Recommended threshold concentrations of SO₂
- SO₂ sources are human-related
- SO₂ pollution in Ukraine is relatively low
- CO is toxic to the brain and heart
- Recommended threshold concentrations of CO
- CO sources are human-related
- Lowest CO levels are found in the mountains, highest in industrial lowlands
- What can be done?
Fine particulate matter can penetrate deep into the lungs
Fine particulate matter (PM2.5 and PM10) refers to solid or liquid particles that can travel through the atmosphere. Their concentrations are often used to assess air pollution levels. They are differentiated by size. Coarse particles — PM10 — range from 2.5 to 10 µm. Fine particles — PM2.5 — are up to 2.5 µm in size.
Particles smaller than 10 microns (≤ PM10) can deeply penetrate the lungs and block them. Particles smaller than 2.5 microns (≤ PM2.5) have a more severe health impact. They can pass through the lung-blood barrier and enter the circulatory system.
The WHO has established a clear link between PM and cardiovascular diseases, chronic obstructive pulmonary disease, acute lower respiratory infections, and lung cancer [1].
Recommended threshold concentrations of particles
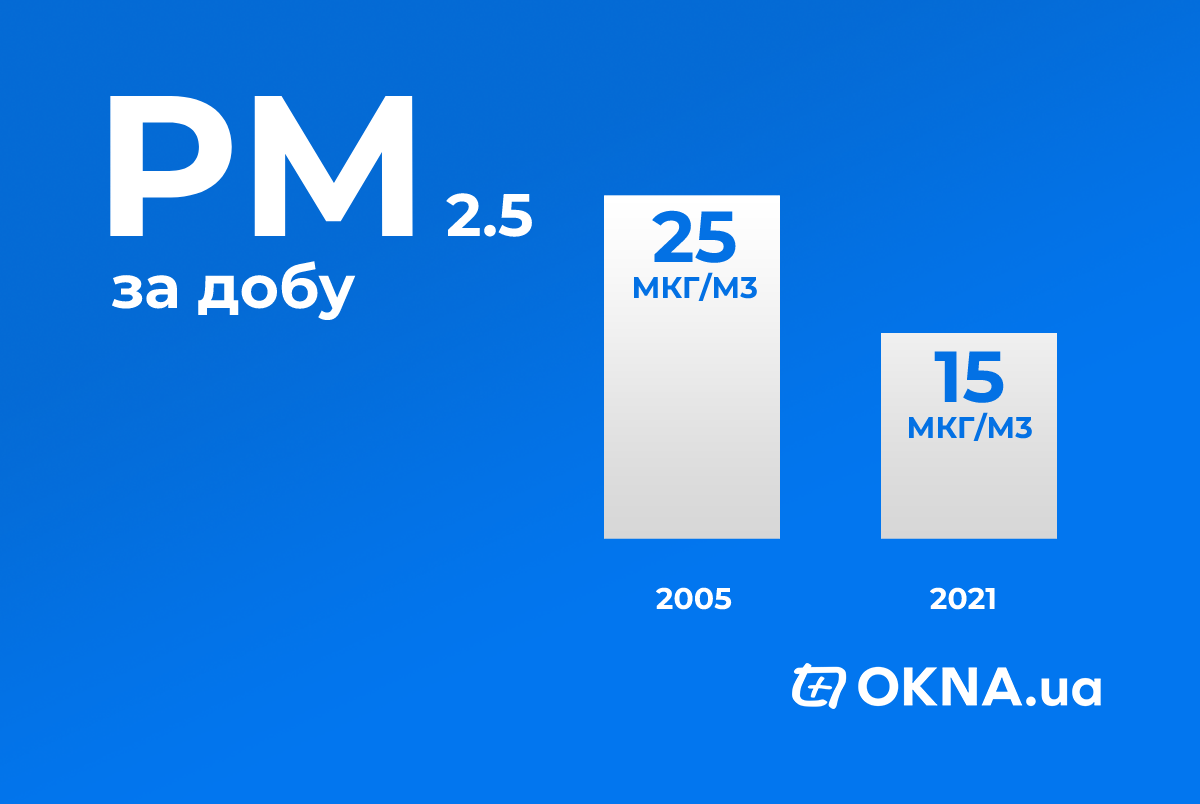
Fine particulate matter (PM2.5) [2]
- ● 5 µg/m3 annual mean;
- ● 15 µg/m3 24-hour mean if exceeded on 3–4 days per year.
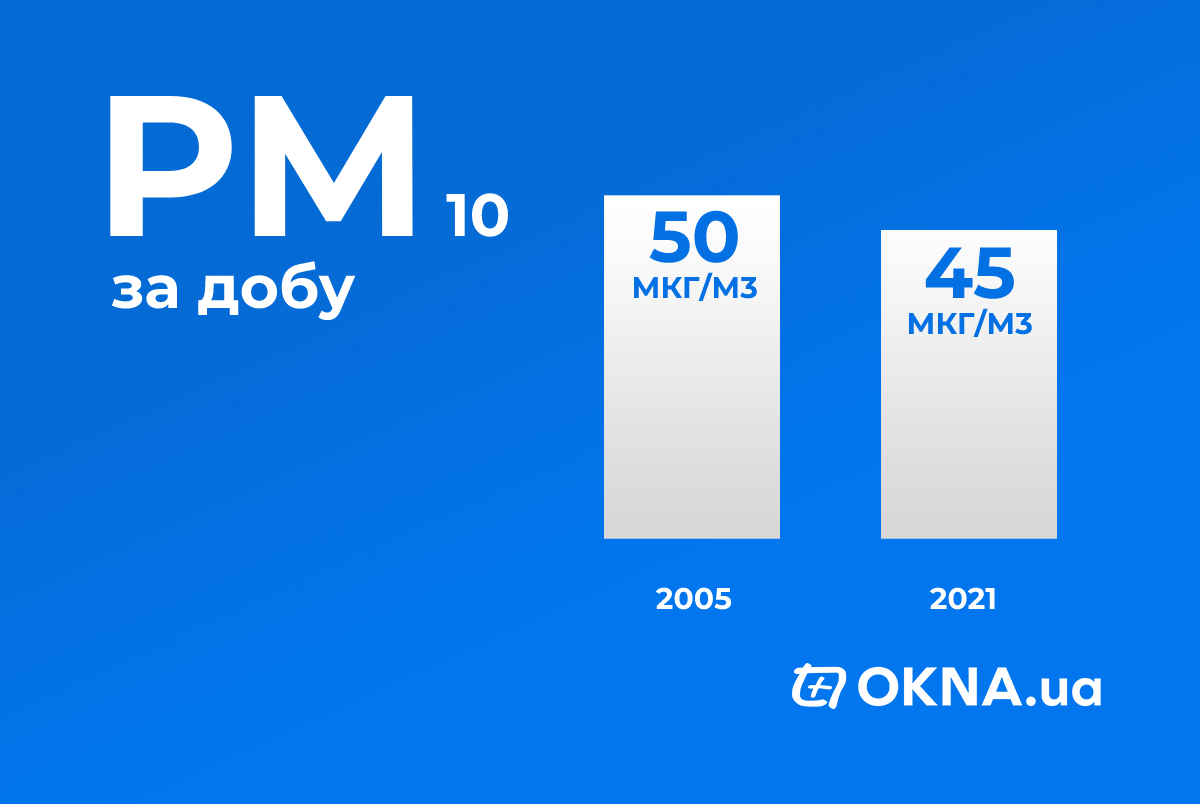
Coarse particulate matter (PM10) [2]
- ● 15 µg/m3 annual mean;
- ● 45 µg/m3 24-hour mean if exceeded on 3–4 days per year.
No safe threshold has been established below which this type of pollution poses no health risk. The guideline values aim to reach the lowest possible concentrations of particulate matter.
Sources of PM are human-related
PM10 appears mainly due to construction activities and wind-blown road dust.
PM2.5 comes from combustion sources, including heating and transport.
Particulates are also released during industrial processes and by power plants.
PM concentrations decrease from south to north of Ukraine
The highest concentrations are observed in the industrial east.
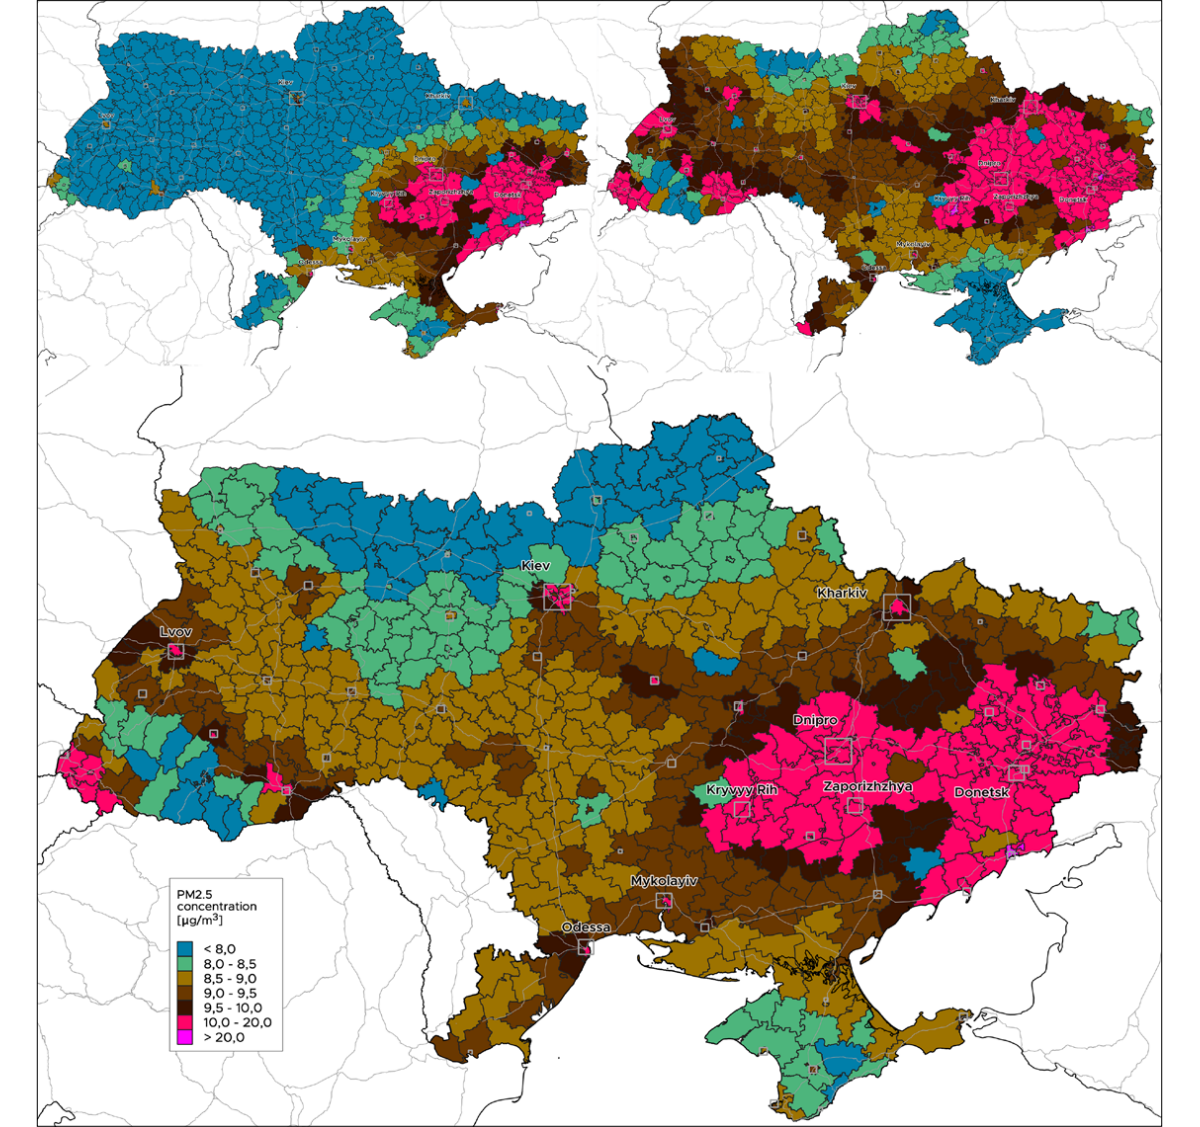
The average PM2.5 concentration across Ukraine reached 9.02 µg/m3 [3].
Most polluted areas:
- ● Donetsk Oblast;
- ● Dnipropetrovsk Oblast;
- ● Kyiv;
- ● Zaporizhzhia Oblast.
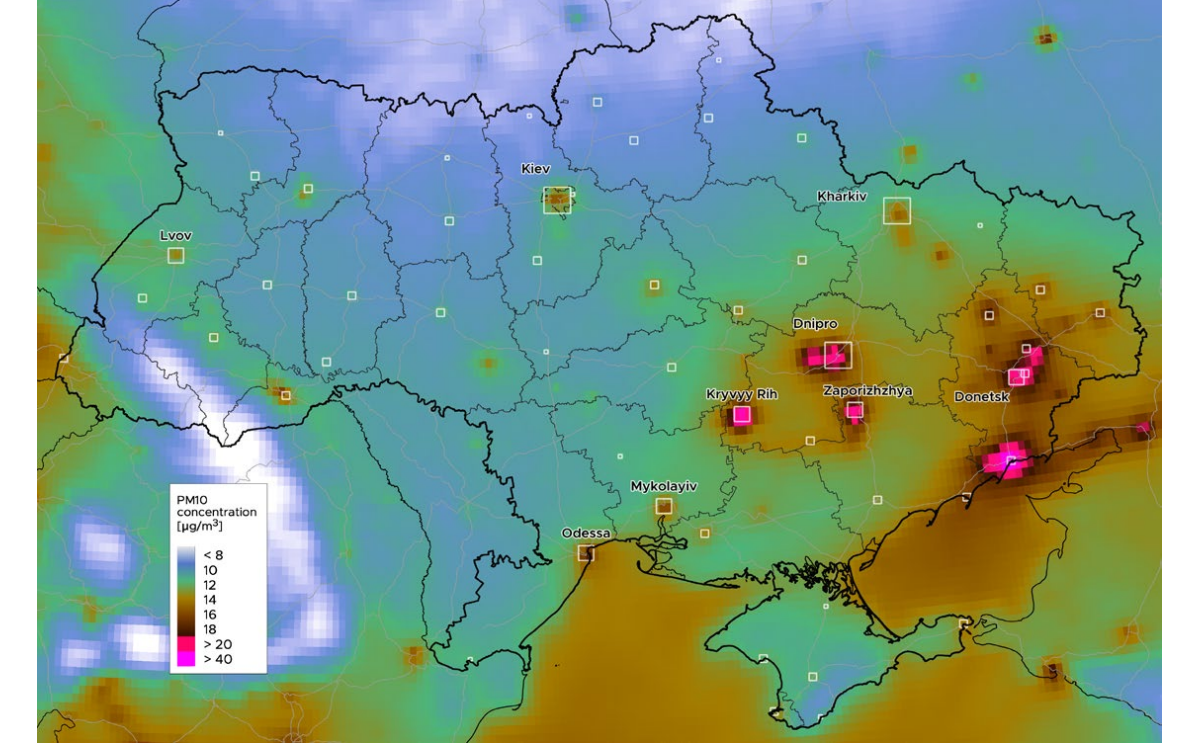
The average PM10 concentration for the selected observation period in Ukraine was 11.79 µg/m3 [3].
Most polluted areas:
- ● Donetsk Oblast;
- ● Dnipropetrovsk Oblast;
- ● Zaporizhzhia Oblast.
Ground-level ozone triggers asthma
We’re used to talking about ozone in the context of the ozone layer, but the WHO distinguishes ground-level ozone (O₃), which is part of photochemical smog. Nitrogen oxides and volatile organic compounds form ozone under sunlight. As a result, ozone pollution peaks during clear weather periods.
Ozone can cause breathing difficulties, trigger asthma, reduce lung function, and cause lung diseases.
The WHO identifies ozone as one of the major contributors to asthma-related illness and mortality [1].
Recommended threshold concentrations of O₃
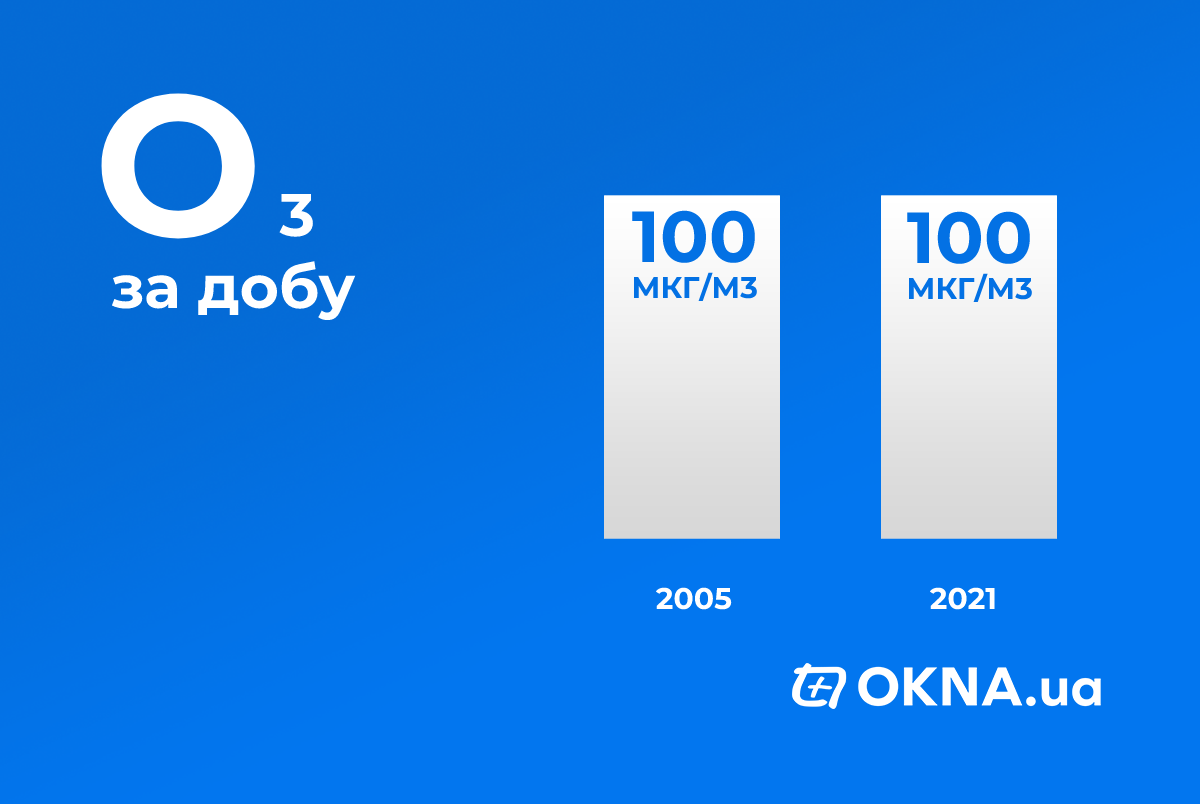
- ● 60 µg/m3 daily 8-hour mean for six consecutive months;
- ● 100 µg/m3 daily 8-hour maximum mean if exceeded on 3–4 days per year [2].
O₃ sources are human-related
Ground-level ozone forms through the action of sunlight on air polluted by nitrogen oxides and volatile organic compounds. These pollutants come from internal combustion engine exhaust, industrial emissions, and the use of solvents.
The highest O₃ pollution is in southeastern Ukraine
Ozone pollution peaks during sunny summer months in southeastern Ukraine. Not necessarily during heat, but on clear days.
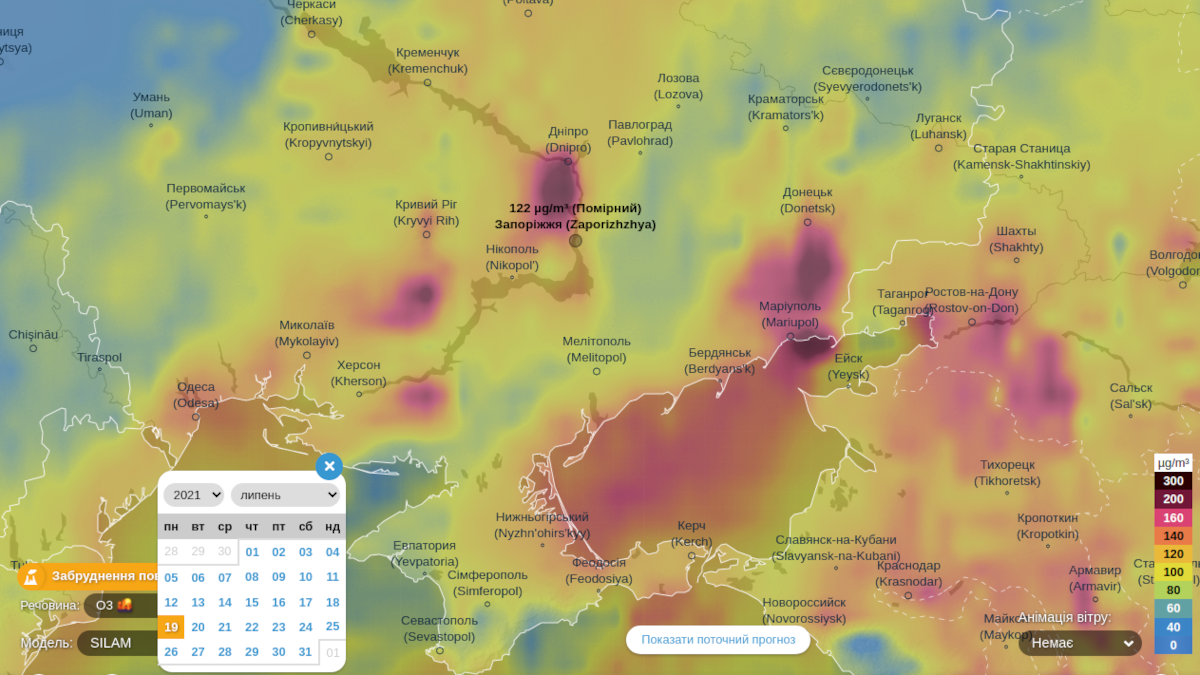
According to meteorological data visualisation platform Ventusky, the most polluted regions in Ukraine are:
- ● Dnipropetrovsk Oblast;
- ● Donetsk Oblast;
- ● Zaporizhzhia Oblast.
Nitrogen dioxide increases vulnerability of the respiratory system
Nitrogen dioxide (NO₂) is an atmospheric pollutant released through various combustion processes. According to the European Environment Agency (EEA) 2018 report [5], more than 60% of NO₂ in European cities comes from car exhausts.
Upon inhalation, up to 90% of NO₂ enters the human body and is absorbed into the bloodstream [5]. It affects lung metabolism, causes inflammation and swelling of tissues, and increases vulnerability to bacterial and viral respiratory infections. According to the WHO [3], higher NO₂ levels can lead to respiratory infections and reduced lung growth and function; they are also associated with worsened bronchitis and asthma symptoms. Even low NO₂ levels can trigger hypersensitivity, symptom flare-ups, and increased airway responsiveness in such patients [6].
Recommended threshold concentrations of NO₂
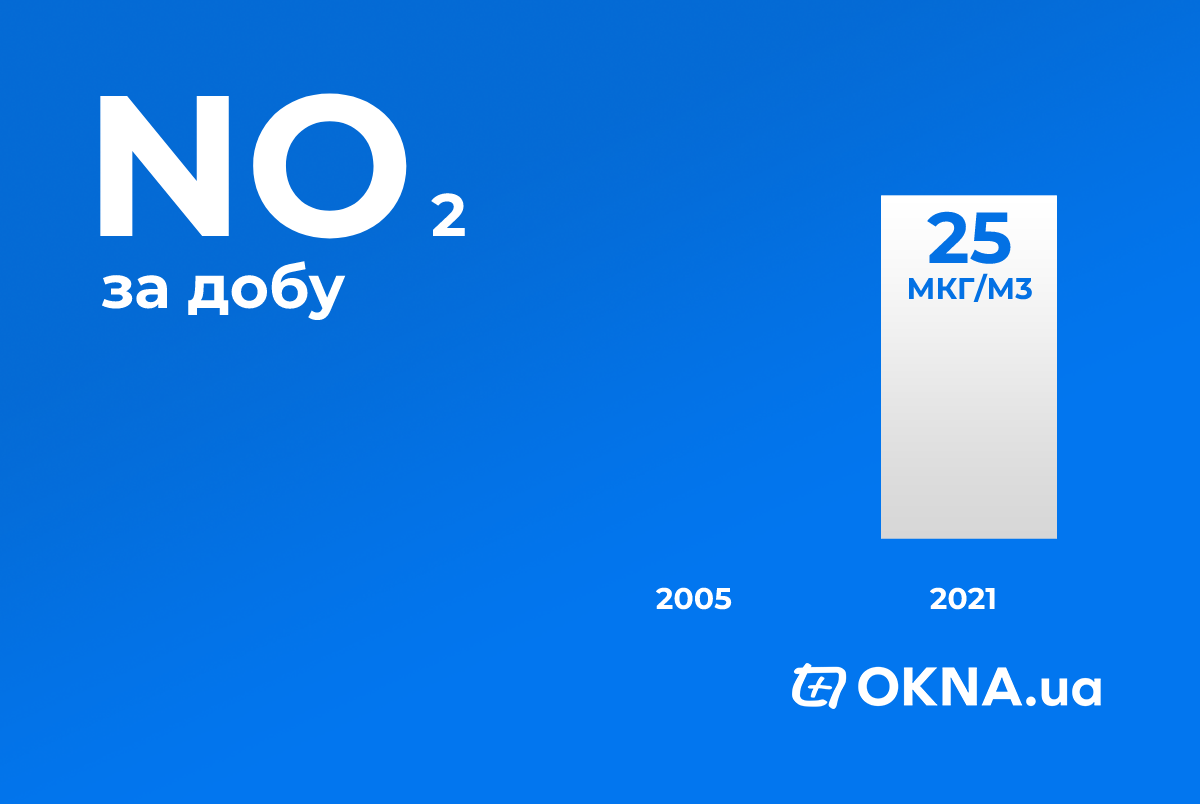
- ● 10 µg/m3 annual mean;
- ● 25 µg/m3 24-hour mean if exceeded on 3–4 days per year [2].
NO₂ sources are human-related
Nitrogen dioxide is released into the atmosphere through combustion in district heating, coal-fired power plants, vehicle exhausts, oil and metal processing, and steel and iron production.
High NO₂ concentrations are observed in Ukraine’s major cities
Higher NO2 concentrations are recorded in the capital, eastern, and southeastern Ukraine. All districts of Kyiv are among the 15 most polluted in the country [3].
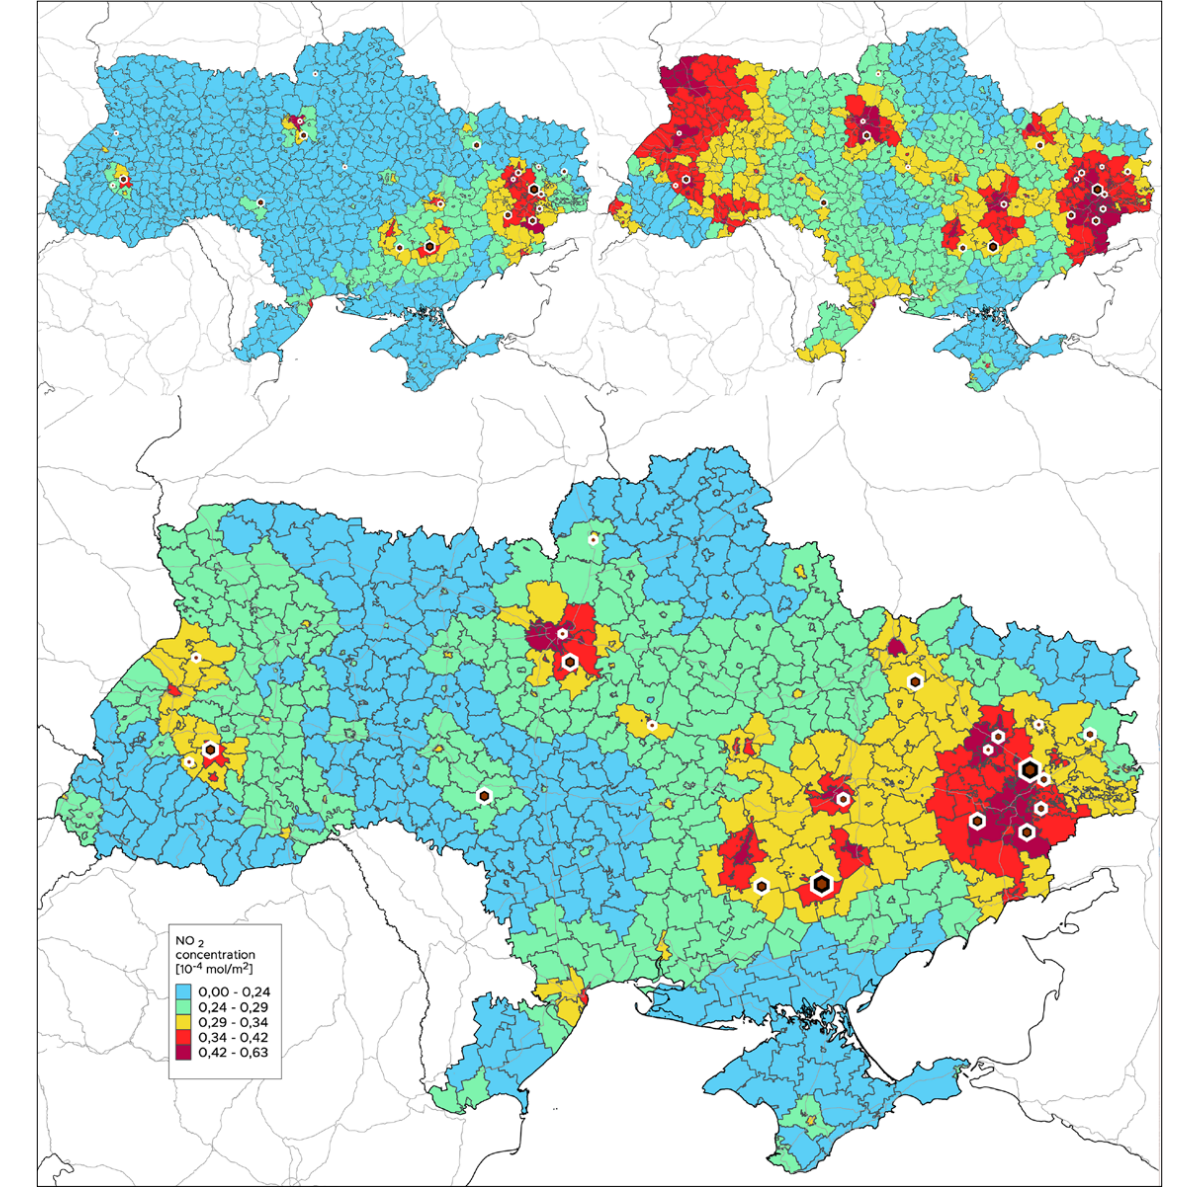
Most polluted regions:
- ● Dnipropetrovsk Oblast;
- ● Donetsk Oblast;
- ● Kyiv Oblast.
SO2 spikes increase heart-related hospitalisations
Sulfur dioxide (SO₂) is a colourless gas with a sharp smell. It forms during the combustion of coal and oil products, and smelting of sulfur-containing mineral ores. When SO₂ reacts with water, it forms sulphurous and sulphuric acids — components of acid rain.
According to the WHO, the gas irritates eyes, inflames the respiratory tract, causes coughing, mucus, worsens asthma and chronic bronchitis, and increases susceptibility to respiratory infections. On days with high SO₂ pollution, hospital admissions and deaths from cardiovascular disease rise [1].
Recommended threshold concentrations of SO₂
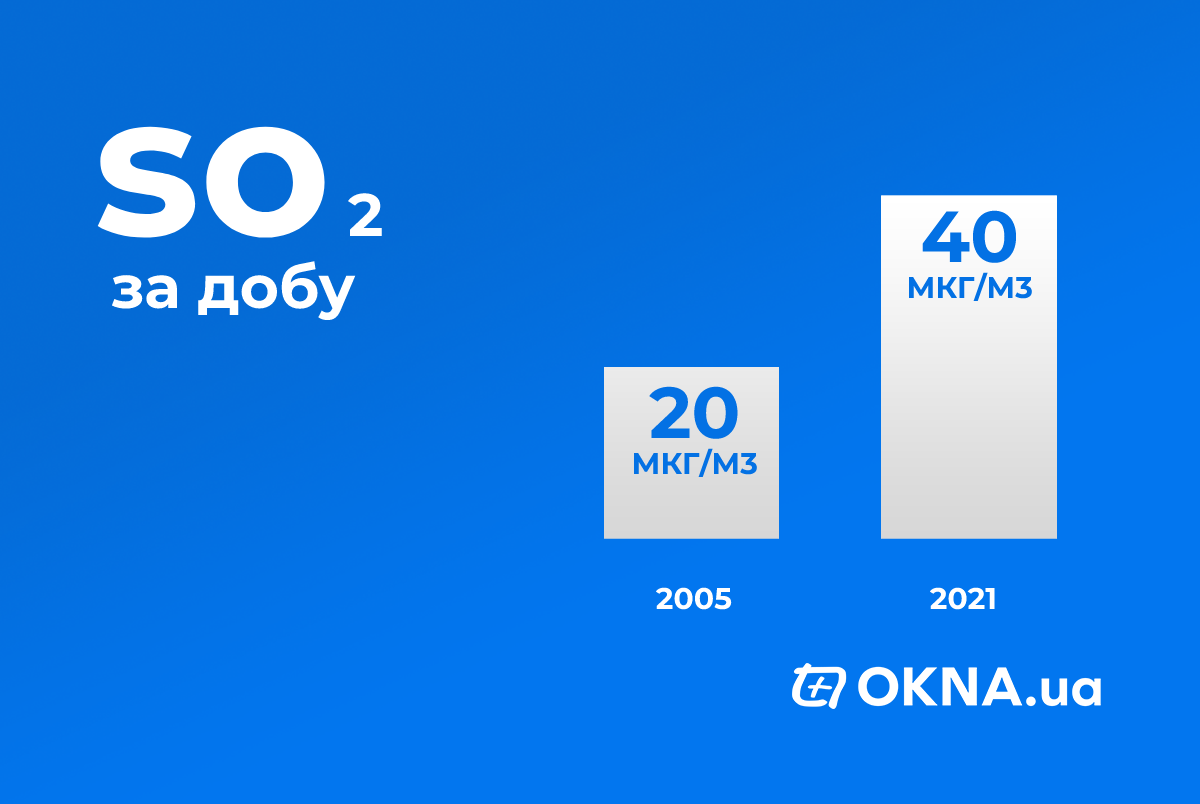
- ● 40 µg/m3 24-hour mean if exceeded on 3–4 days per year [2].
The causal link between low-level SO2 exposure and pathological conditions remains inconclusive. However, the WHO emphasises that reducing SO2 levels may also lower concentrations of associated pollutants [1].
SO₂ sources are human-related
Sulfur dioxide is released by coal-fired power stations, industrial processes, or other fossil fuel burning such as residential heating.
SO₂ pollution in Ukraine is relatively low
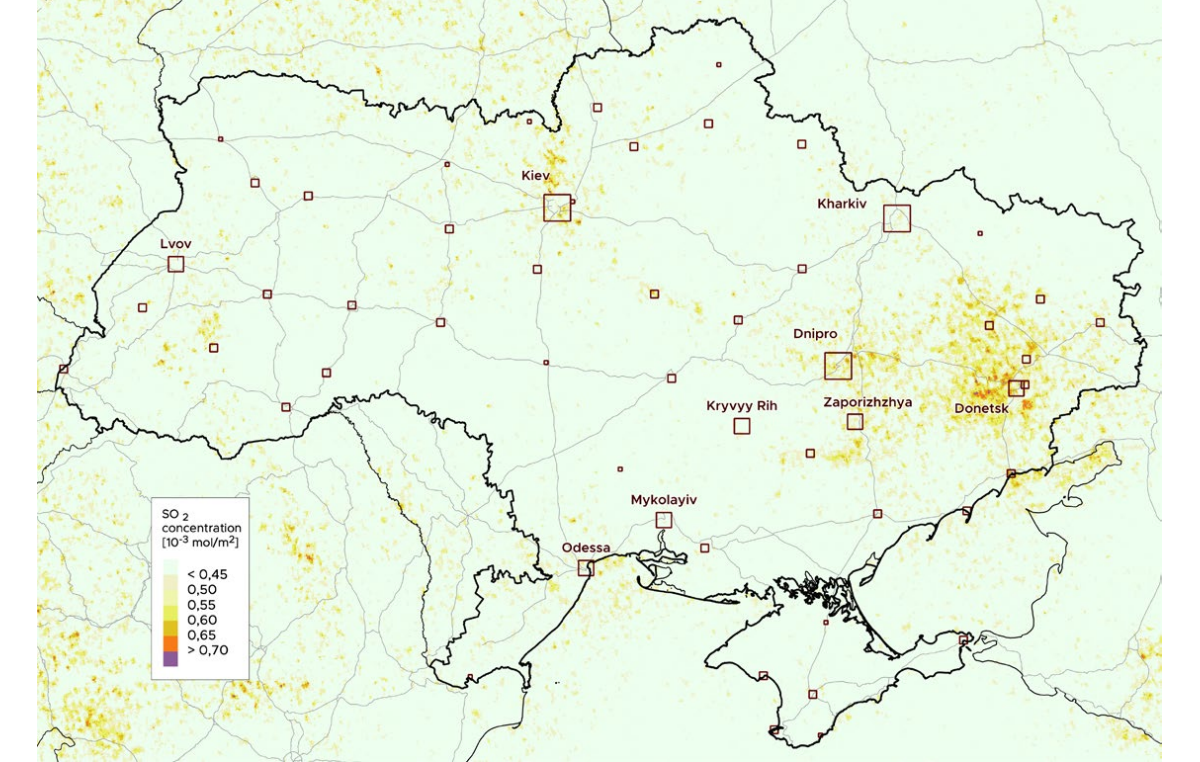
SO2 concentrations in Ukraine follow a clear seasonal pattern, peaking from November to January. This likely correlates with increased residential heating [3].
Most polluted regions:
- ● Zaporizhzhia Oblast;
- ● Dnipropetrovsk Oblast;
- ● Donetsk Oblast;
- ● Kyiv.
CO is toxic to the brain and heart
Carbon monoxide, or CO, is a poisonous, colourless, tasteless, and odourless gas. It is a product of incomplete combustion. CO enters the atmosphere from vehicles, fossil fuel use, waste and charcoal burning, and tobacco smoke [3].
Carbon monoxide has toxic effects on organs with high oxygen demand—the brain and heart. It has a proven negative impact on maternal health during pregnancy and may lead to congenital heart defects in infants. It increases the risk of all respiratory diseases.
High CO levels also amplify the effects of other pollutants: O3, SO2, PM, and NO2 [3].
Recommended threshold concentrations of CO
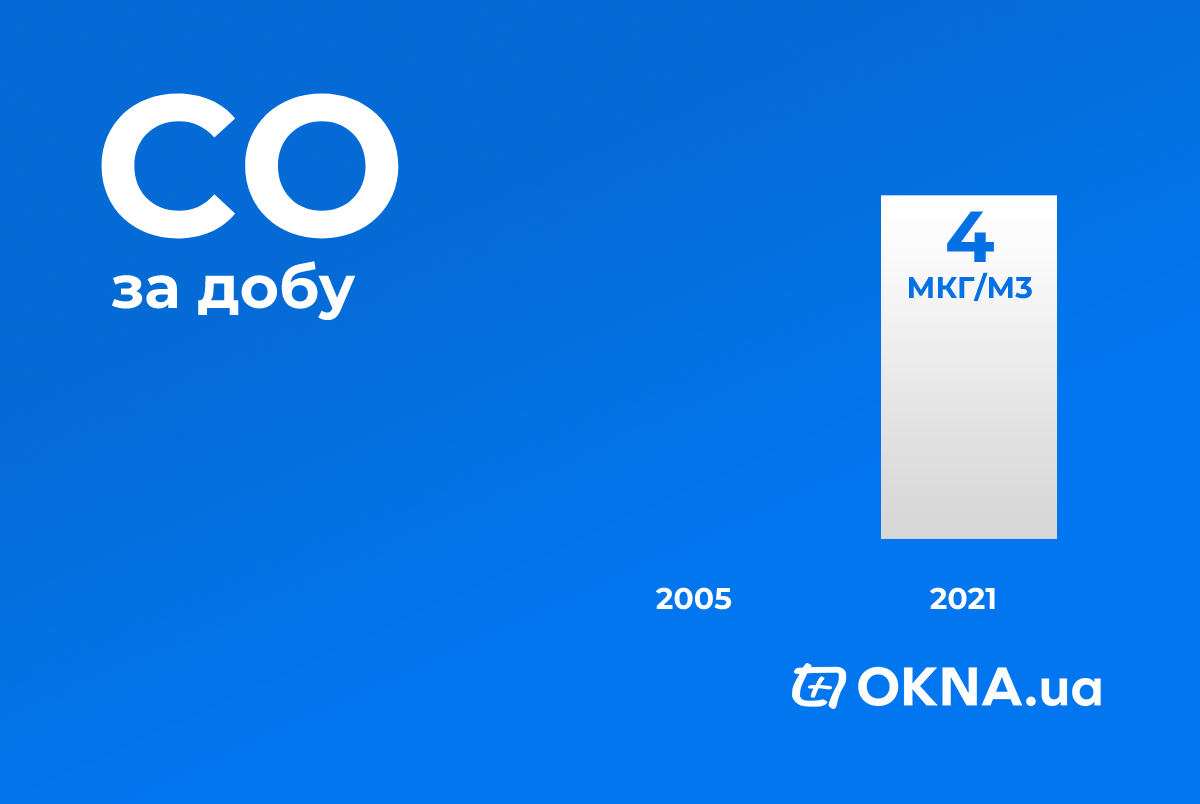
- ● 4 µg/m3 24-hour mean if exceeded on 3–4 days per year [2].
CO sources are human-related
Carbon monoxide is emitted during vehicle operation, coal-based energy production, biomass burning, and in the coking and metallurgical industries.
Cigarette smoke also increases CO levels in the atmosphere.
Major sources of carbon monoxide emissions include wildfires and burning last year’s leaves and grass.
Lowest CO levels are found in the mountains, highest in industrial lowlands
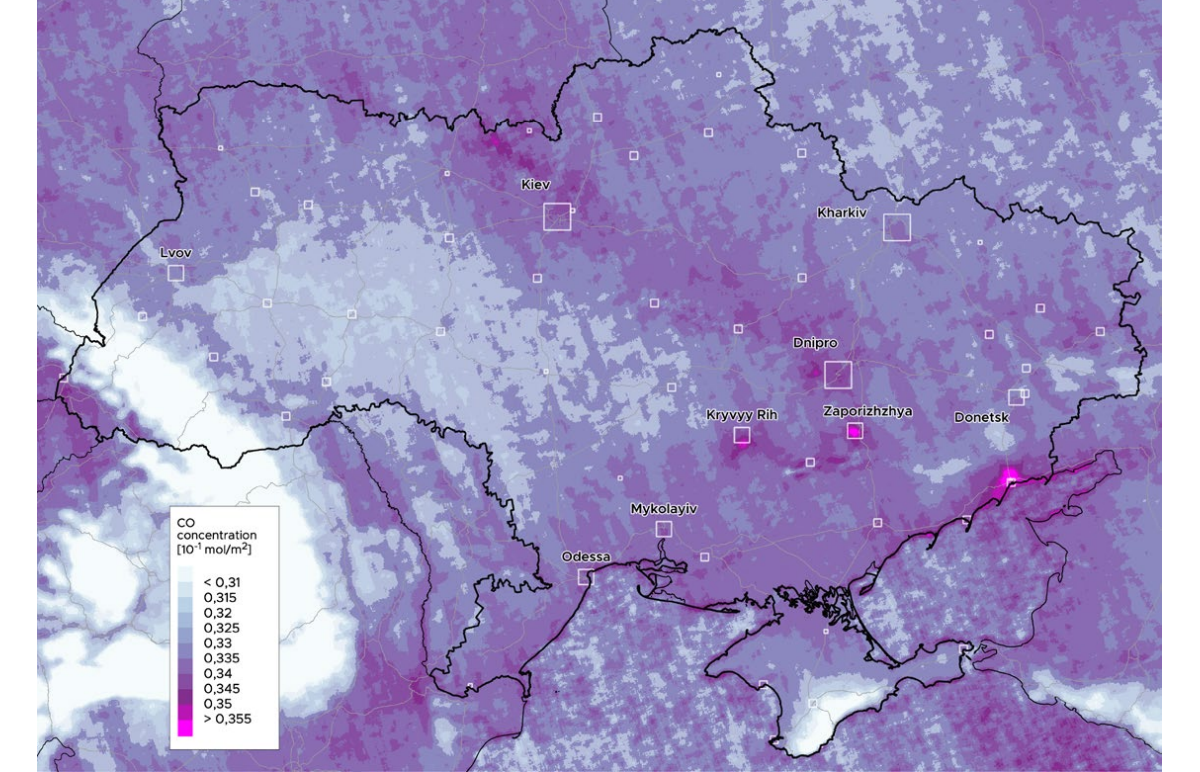
CO concentrations increase in winter and early spring, peaking in April before sharply declining. The lowest levels during the selected observation period were recorded in July [3].
Most polluted regions:
- ● Dnipropetrovsk Oblast;
- ● Zaporizhzhia Oblast;
- ● Kyiv;
- ● Kherson Oblast.
What can be done?
In the short term, it’s important to monitor outdoor air parameters and ventilate rooms when conditions are favourable.
Globally, humanity must reduce emissions. This would not only mitigate climate change effects but also improve air quality and preserve health.
Even before the stricter pollution criteria were introduced, it was noted that nearly 92% of the world’s population breathes air that exceeds permissible levels. According to the WHO, air pollution causes 14,400 deaths annually in Ukraine [3].
The list of “classic” pollutants is not exhaustive but merely the most studied. Other pollutants also have harmful effects.
Sources:
- Загрязнение атмосферного воздуха // WHO (russian)
- WHO global air quality guidelines. Particulate matter (PM2.5 and PM10), ozone, nitrogen dioxide, sulfur dioxide and carbon monoxide // WHO
- Air pollution in Ukraine from space // Arnika – Citizen Support Centre (Ukrainian)
- Ambient air pollution // WHO
- Air quality in Europe — 2018 report // EEA
- Nitrogen dioxide // WHO