Ukrainian PVC window and door market 2025
- Section 1. Executive summary
- Section 2. Foreign trade: the full value chain
- 2.1 PVC resin (HS 390410) — raw material
- 2.2 PVC profiles (HS 391620) — semi-finished products
- 2.3 Finished PVC windows and doors (HS 392520) — end product
- 2.4 Consolidated trade balance of the sector
- Section 3. Construction activity — demand
- 3.1 Volume of construction work
- 3.2 Housing completions
- 3.3 ProZorro public procurement (CPV 44221000-5)
- Section 4. Pricing environment and macroeconomic factors
- Section 5. Regulatory environment
- Section 6. Analytical conclusions and outlook
- 6.1 Key trends of 2025
- 6.2 Risk matrix for 2026
- 6.3 Outlook for 2026
- Section 7. Source register
Section 1. Executive summary
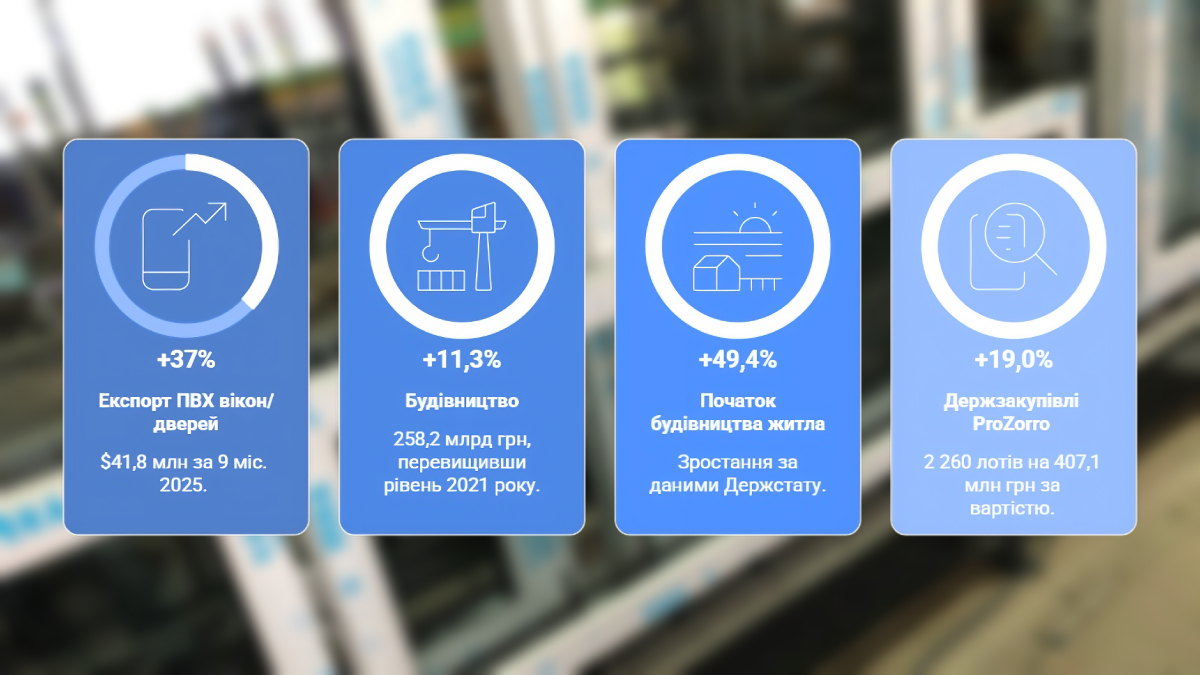
Key figure for 2025: exports of PVC windows and doors from Ukraine for the first nine months of 2025 reached $41.8 million, surpassing the full-year figure for 2024 ($40.6 million) and recording growth of +37% year-on-year. Ukraine is a strong net exporter of finished PVC structures, whilst importing significant volumes of profiles and PVC resin as raw materials.
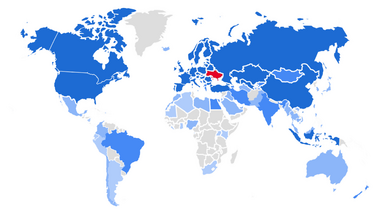
- • Exports of PVC windows/doors (HS 392520): record $41.8 million for 9 months of 2025 (+37% y/y). Key markets: Germany, Poland, USA, Lithuania (ITC Trade Map).
- • Imports of PVC profiles (HS 391620): $45.1 million in 2024, $32.5 million for 9 months of 2025. Key suppliers: Poland (56%), Turkey (17%), Germany (15%).
- • Imports of PVC resin (HS 390410): $81.6 million in 2024, $63.5 million for 9 months of 2025. Key supplier — USA (52%), Hungary (14%), Germany (14%).
- • Construction: 258.2 billion hryvnias (+11.3% y/y), volume exceeded pre-war 2021 levels. Housing construction starts rose by +49.4% (State Statistics Service).
- • ProZorro public procurement (CPV 44221000-5): 2,260 lots totalling 407.1 million hryvnias (+19.0% y/y by value), with a peak in December (263 lots).
- • Inflation 8.0% y/y, NBU key policy rate reduced from 15.5% to 15.0% (30.01.2026).
Overall market direction: growth, supported by construction activity, public procurement, and record exports.
Section 2. Foreign trade: the full value chain
2.1 PVC resin (HS 390410) — raw material
Polyvinyl chloride in primary forms (suspension S-PVC, grades SG-5/SG-7) is the base raw material for profile extrusion. It accounts for 40–50% of profile production costs.
| Year | Imports, thousand USD | Exports, thousand USD | Net imports |
|---|---|---|---|
| 2022 | 79,058 | 71,304 | 7,754 |
| 2023 | 92,993 | 26 | 92,967 |
| 2024 | 81,578 | 15 | 81,563 | 2025 (Q1–Q3) | 63,536 | 10 | 63,526 |
Source: ITC Trade Map, direct data (State Statistics Service), HS code 390410. Date accessed: 01.04.2026.
Top suppliers of PVC resin in 2024: USA ($42.5 million — 52%), Hungary ($11.7 million — 14%), Germany ($11.2 million — 14%), Poland ($7.2 million — 9%). In 2025, US dominance continues, whilst the shares of Hungary and Poland have decreased.
2.2 PVC profiles (HS 391620) — semi-finished products
| Year | Imports, thousand USD | Exports, thousand USD | Net imports |
|---|---|---|---|
| 2022 | 42,772 | 14,695 | 28,077 |
| 2023 | 52,620 | 12,895 | 39,725 | 2024 | 45,100 | 14,408 | 30,692 |
| 2025 (Q1–Q3) | 32,461 | 12,178 | 20,283 |
Source: ITC Trade Map, direct data (State Statistics Service), HS code 391620.
Geography of profile imports (2024 → 2025)
| # | Country | 2024, thousand USD | Share | 2025 Q1–Q3 | Share |
|---|---|---|---|---|---|
| 1 | Poland | 25,433 | 56.4% | 19,046 | 58.7% |
| 2 | Turkey | 7,469 | 16.6% | 4,531 | 14.0% |
| 3 | Germany | 6,630 | 14.7% | 4,871 | 15.0% |
| 4 | Bulgaria | 2,880 | 6.4% | 1,561 | 4.8% |
| 5 | China | 1,202 | 2.7% | 924 | 2.8% |
| 6 | Italy | 551 | 1.2% | 399 | 1.2% |
| World | 45,100 | 100% | 32,461 | 100% |
Source: ITC Trade Map, direct data. Poland is the dominant supplier (plants operated by REHAU, Salamander, Aluplast, Gealan).
Geography of profile exports — Moldova as the primary market
Profile exports: $14.4 million (2024), of which Moldova accounts for $13.0 million (91%). Other destinations — Bulgaria, Germany, Serbia — represent negligible volumes.
2.3 Finished PVC windows and doors (HS 392520) — end product
Ukraine is a strong net exporter of finished PVC structures.
| Year | Imports, thousand USD | Exports, thousand USD | Net exports |
|---|---|---|---|
| 2021 | 2,948 | 32,332 | +29,384 |
| 2022 | 1,223 | 24,703 | +23,480 | 2023 | 1,233 | 32,338 | +31,105 |
| 2024 | 1,661 | 40,585 | +38,924 |
| 2025 (Q1–Q3) | 1,034 | 41,800 | +40,766 |
Source: ITC Trade Map, direct data (State Statistics Service), HS code 392520.
Geography of window/door exports (2024 → 2025)
| # | Country | 2024, thousand USD | Share | 2025 Q1–Q3 | Share | YoY* |
|---|---|---|---|---|---|---|
| 1 | Germany | 10,628 | 26.2% | 10,031 | 24.0% | 24.0% |
| 2 | Poland | 10,568 | 26.0% | 9,112 | 21.8% | +15% |
| 3 | USA | 5,575 | 13.7% | 5,553 | 13.3% | +33% |
| 4 | Lithuania | 2,983 | 7.4% | 4,302 | 10.3% | +92% |
| 5 | Romania | 2,860 | 7.0% | 1,948 | 4.7% | −9% |
| 6 | Italy | 2,182 | 5.4% | 2,436 | 5.8% | +49% |
| 7 | Spain | 1,200 | 3.0% | 2,204 | 5.3% | +145% |
| 8 | Canada | 1,372 | 3.4% | 1,427 | 3.4% | +39% |
| World | 40,585 | 100% | 41,800 | 100% | +37% |
* YoY calculation: (2025 Q1–Q3 / 2024 Q1–Q3 − 1) × 100%. Source: ITC Trade Map.
Key highlights: Lithuania (+92%), Spain (+145%), Italy (+49%) — new high-growth destinations. Exports in Q3 2025 alone reached $16.1 million (a record). The full-year 2025 figure is estimated at $55–58 million.
2.4 Consolidated trade balance of the sector
| Indicator | 2024, thousand USD | 2025 (estimate*) |
|---|---|---|
| Imports of PVC resin (390410) | 81,578 | ~85,000 |
| Imports of profiles (391620) | 45,100 | ~43,000 |
| Imports of windows/doors (392520) | 1,661 | ~1,400 |
| Total imports | 128,339 | ~129,400 |
| Exports of profiles (391620) | 14,408 | ~16,000 |
| Exports of windows/doors (392520) | 40,585 | ~57,000 |
| Total exports | 54,993 | ~73,000 |
| Net imports of the sector | −73,346 | −56,400 |
* Full-year 2025 estimate based on Q1–Q3 data. Source: ITC Trade Map (direct data).
Section 3. Construction activity — demand
3.1 Volume of construction work
| Indicator | 2024 | 2025 | YoY |
|---|---|---|---|
| Volume of construction work, billion hryvnias | 204.7 | 258.2 | +11.3%* |
| — residential | 26.6* | 34.5 | +13.5%* |
| — non-residential | 57.7* | 86.1 | +25.4%* |
| — civil engineering | 120.4* | 137.5 | +3.1%* |
Source: State Statistics Service (interfax.com.ua, forbes.ua, March 2026). * Revised figures.
3.2 Housing completions
| Indicator | 2024 | 2025 | YoY |
|---|---|---|---|
| Total floor area of residential buildings accepted, thousand sq. m | 9,757 | 9,535 | −2.3% |
| — single-family | 4,975 | 5,034 | +1.2% |
| — multi-family | 4,783 | 4,501 | −5.9% |
| Housing construction starts, thousand sq. m | 3,903 | 5,830 | +49.4% |
| Non-residential buildings (accepted), thousand sq. m | 4,414 | 4,141 | −6.2% |
Source: State Statistics Service, dataset SSSU_DF_BEGINING_COMPLETION_CONSTRUCTION, downloaded 01.04.2026.
Key point: housing construction starts rose by 49.4% — a leading indicator for demand for PVC structures in 2026–2027. Completions declined by 2.3%, reflecting a lag from projects initiated in 2022–2023.
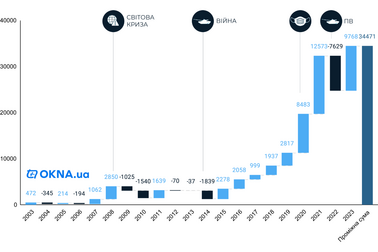
3.3 ProZorro public procurement (CPV 44221000-5)
| Indicator | 2022 | 2023 | 2024 | 2025 | YoY 25/24 |
|---|---|---|---|---|---|
| Number of lots | 1,600 | 2,840 | 2,160 | 2,260 | +4.6% |
| Expected value, million hryvnias | 314.9 | 382.6 | 342.2 | 407.1 | +19.0% |
| Number of contracting authorities | 1,030 | 1,610 | 1,340 | 1,400 | +4.5% |
| Number of bidders | 1,030 | 1,460 | 1,220 | 1,210 | −0.8% |
| Average number of bidders | 1.94 | 1.96 | 2.05 | 1.84 | −10.2% |
Source: bi.prozorro.org, CPV 44221000-5 "Windows, doors and related products". Screenshots dated 31.03.2026.
Monthly dynamics for 2025: Jan=105, Feb=144, Mar=178, Apr=165, May=207, Jun=199, Jul=205, Aug=173, Sep=217, Oct=203, Nov=205, Dec=263 lots. The December peak (263 lots) is the highest figure for the year, indicating active year-end budget expenditure.
Competition has declined: from 2.05 to 1.84 bidders per lot. Contract value grew by 19% whilst the number of lots increased by only 4.6% — indicating growth in contract size.
Section 4. Pricing environment and macroeconomic factors
| Indicator | 2025 | Source | |
|---|---|---|---|
| USD/UAH exchange rate (start→end) | ~41.2 → ~42.5 hryvnias/USD | NBU | |
| CPI (December to December) | 8.0% | State Statistics Service / NBU | |
| NBU key policy rate | 14.5% → 15.5% (Mar.) → 15.0% (30.01.2026) | NBU | |
| Total goods imports | $84.8 billion (+14.9% y/y) | State Customs Service | |
| Gold and foreign exchange reserves | $54.7 billion | NBU | |
| S-PVC prices (Europe) | Stable-to-soft, with upward attempts in Q4 | ChemOrbis | |
| Industrial output | −1.7% y/y | State Statistics Service |
Sources: NBU (bank.gov.ua); State Statistics Service; State Customs Service (customs.gov.ua); ChemOrbis.
Section 5. Regulatory environment
| Parameter | Status |
|---|---|
| Duty on HS 390410 (PVC resin) | 6.5% |
| Duty on HS 391620 (profiles) | 6.5% |
| Duty on HS 392520 (windows/doors) | 6.5% |
| VAT on imports | 20% |
| Anti-dumping measures | None recorded |
| Customs reform | Harmonisation with the EU Customs Code; NCTS: 142,000 declarations |
| EU financial support | EUR 90 billion for 2026–2027 (USL) |
| IMF programme | $8.1 billion (pending approval) |
Section 6. Analytical conclusions and outlook
6.1 Key trends of 2025
- Record exports of PVC windows and doors
$41.8 million for 9 months (+37%). Lithuania, Spain, Italy — new high-growth destinations. Full-year forecast: $55–58 million. - Construction starts up +49%
5.83 million sq. m vs 3.90 million sq. m in 2024 (State Statistics Service). A leading indicator — demand for PVC windows is expected to rise with a lag of 12–18 months. - Public procurement growing in value (+19%)
407 million hryvnias (+19%), 2,260 lots (+5%). Contract size is increasing whilst competition is declining. - PVC resin imports — dependence on the USA
52% of PVC resin imports ($42.5 million) originate from the USA. Risk exposure in the event of changes to US trade policy (Trump tariffs). - Construction output has exceeded pre-war levels
258.2 billion hryvnias > 258 billion hryvnias (2021). Non-residential construction is the leading segment (+25.4%).
6.2 Risk matrix for 2026
| Risk | Probability | Impact | Signal |
|---|---|---|---|
| Hryvnia depreciation | M | M | NBU, budget rate 45.7 hryvnias/USD |
| Dependence on resin imports from the USA | H | H | 52% from a single country, tariff risk |
| Declining competition in ProZorro | M | M | 1.84 bidders (−10%) |
| Energy shortages / rising tariffs | H | H | NBU, Ukrenergo |
| Weakening EU demand | M | H | ChemOrbis — weak EU construction market |
| Rising imports from China | M | M | ITC — growth of +77% (windows) |
H — high level, M — medium level, L — low level.
6.3 Outlook for 2026
- • Window/door exports: +15–20% to $60–70 million. Basis: +37% trend, market diversification, EUR 90 billion from the EU.
- • Profile imports: stable at $40–45 million. Basis: production requirements for the domestic market and exports.
- • PVC resin imports: $80–90 million. Basis: production growth at stable prices.
- • Domestic demand: +10–15% on the back of +49% construction starts (12–18 month lag) and public procurement activity.
- • Public procurement: 2,500–2,800 lots, 450–500 million hryvnias. Basis: +19% trend, reconstruction programmes.
Section 7. Source register
| # | Title | Source | Date accessed |
|---|---|---|---|
| 1 | Import/Export HS 391620, 392520, 390410 | ITC Trade Map / State Statistics Service | 01.04.2026 |
| 2 | ProZorro CPV 44221000-5 (2022–2025) | bi.prozorro.org | 31.03.2026 |
| 3 | Construction work 2025 | State Statistics Service (interfax, forbes) | 03.2026 |
| 4 | Completions / construction starts | State Statistics Service SDMX API | 01.04.2026 |
| 5 | General customs statistics 2025 | State Customs Service customs.gov.ua | 02.2026 |
| 6 | CPI 2025, inflation 8.0% | State Statistics Service / NBU | 01.2026 |
| 7 | Key policy rate, reserves | NBU bank.gov.ua | 30.01.2026 |
| 8 | PVC prices | ChemOrbis | 01.2026 |
| 9 | ProZorro PDF lots 2024–2025 | prozorro.gov.ua | 01.04.2026 |
Methodological note: Trade Map data for HS codes 391620 and 392520 are direct data from Ukraine (State Statistics Service). Data for HS 390410 are also direct data. Year 2025: Q1–Q3 (9 months), full-year figures estimated by extrapolation. ProZorro: CPV 44221000-5 "Windows, doors and related products", data from bi.prozorro.org. Construction statistics: State Statistics Service SDMX datasets (data.gov.ua). All foreign trade values are in thousand USD.
Annual analytical report
| Field | Value |
|---|---|
| Reporting period | January – December 2025 |
| Date of preparation | 01.04.2026 |
| HS codes | 390410 (PVC resin) • 391620 (profiles) • 392520 (windows/doors) |
| Sources | ITC Trade Map • State Statistics Service • bi.prozorro.org • NBU |
This material was prepared with the use of artificial intelligence tools, under the editorial supervision of the author.